Link
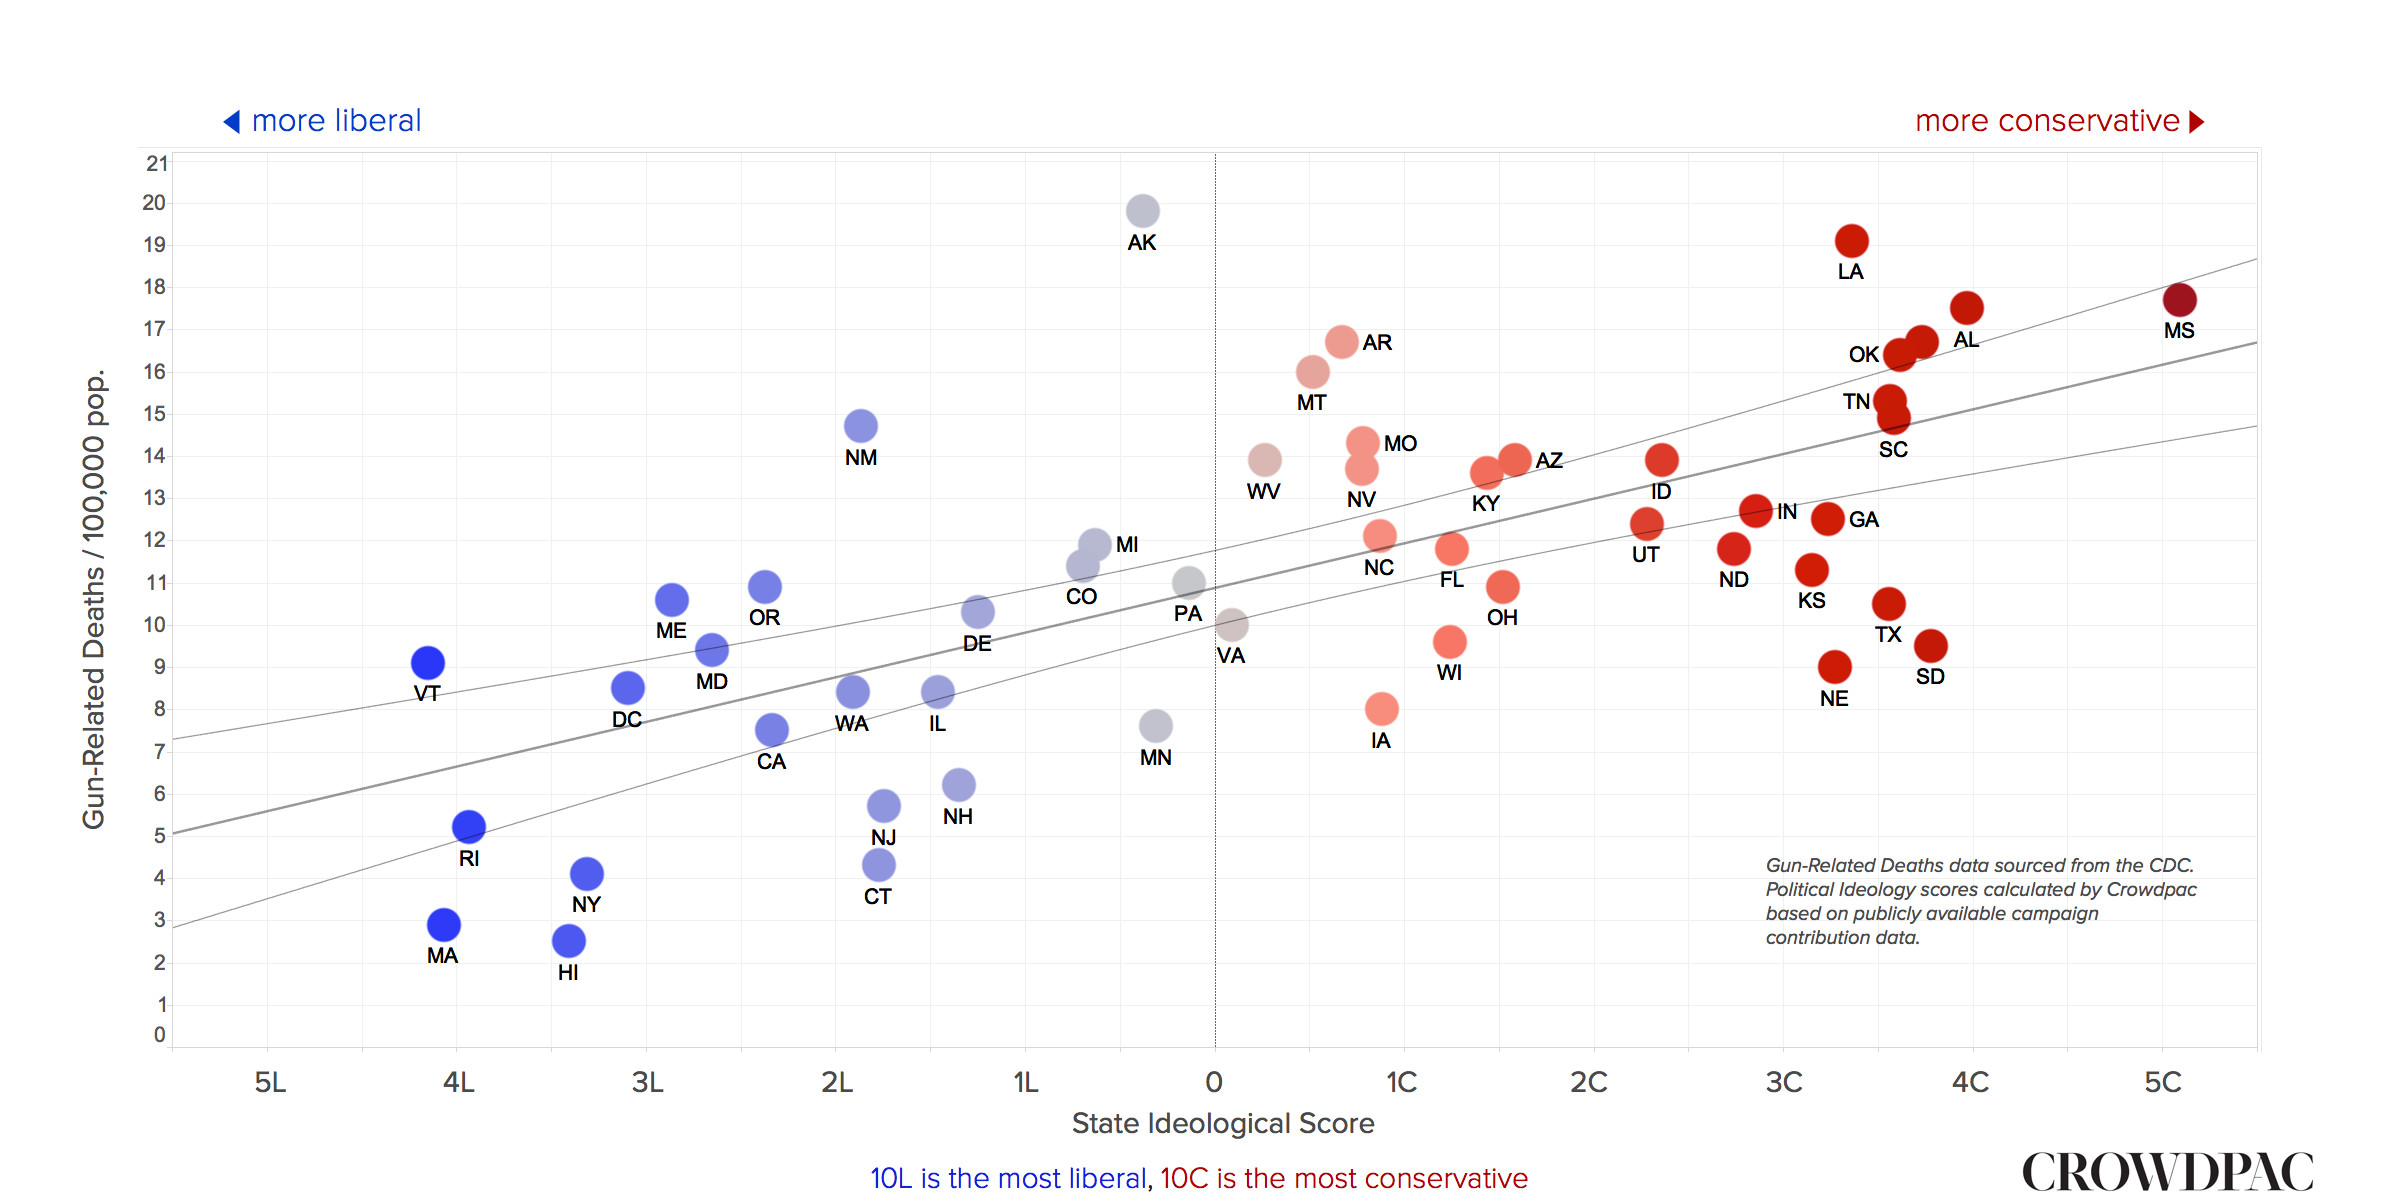
We calculated a score for each state based on the political donations of the people who live there, using campaign finance records from 2004 to 2016. Scores range from 10L (most liberal) to 10C (most conservative).
We then mapped these 'state political leaning' scores against official data on gun-related deaths per capita. As it turns out, there is a significant correlation (.66) between a state's political leaning and the number of gun deaths it registers.
We then mapped these 'state political leaning' scores against official data on gun-related deaths per capita. As it turns out, there is a significant correlation (.66) between a state's political leaning and the number of gun deaths it registers.
ReplyDeleteHow come when I show you a correlation coefficient I am “baffling you with bullshit” but when some anti-gun propaganda does the same math it is “common sense and honesty”? The only difference between what I have done and this is that I used murder rates while they used “gun deaths per capita” (which you have previously agreed is deceptive, but here you are calling it “common sense and honesty”). Of course substituting in murder rate makes the line complete flat, which explains why they calculate it with “gun deaths” instead.
As I've said a time or two before, you're highly baffling bullshit is predicated on the unbelievable (literally) idea that knives and baseball bats make up the difference. The multiple murders committed with guns alone are enough to disprove your bunk.
DeleteI simply showed you the numbers, Mike. It's the same correlation math here which you dubbed "common sense and honesty". What you literally can't believe has little to do with what is actually true. You can literally find it unbelievable that the world is round, despite me presenting you with all the evidence that it is. What else can I say?
DeleteMikeB: "...predicated on the unbelievable (literally) idea that knives and baseball bats make up the difference. "
Substitution is just one factor, and a pretty minor one. A much bigger factor for why the numbers are what they are is that substitution isn't necessary because the criminals still have guns despite gun control because gun control doesn't frickin work! You say so yourself. Remember how you always say "we have no gun control" and how criminals can drive to other states? Remember? So why do you play dumb and claim substitution is the only explanation I offer for why violence and murder is not correlated with gun laws or gun ownership?
Yet another important factor is that guns are useful in defense. Clearly you must remember how I have talked about that before. Guns have a good side and a bad side. Obviously there are more things working into the equation besides substitution.
Pretty amusing to find some sort of correlation between gun deaths and political spending. I wonder where Virginia would sit on the graph after taking into account former Mayor Bloomberg's expenditure of just under two million dollars in elections there.
ReplyDeleteAlso interesting to note the state's on the liberal side of the graph with good attitudes about gun rights that are reflected by poor grades from the gun control lobby. Those would be Vermont, Maine, and New Hampshire.
It is amusing and entertaining - and it makes sense too.
DeleteMeh, line looks pretty flat to me. In fact the blues look higher.
DeleteI'm not surprised the lines look flat to you.
Delete